Introductory Data Science Part 1: The Process
This is part 1 of the series which introduce the basic elements in Data Science.
Over the past few years, the term Data Science is getting more popular. There are many online courses teaching data science but everyone has their own defintion on it. Statistics, Big Data, Artificial Intelligence, Machine Learning, etc. are all components of data science, but people sometimes ignored the fact that even a small-scaled data analysis could also be called data science because it actually requires an intelligent data mindset.
In this article, we will put aside the hype of Big Data and Machine Learning, instead, having an overview on data analytic process in general and have a look at the steps comprising data analysis.
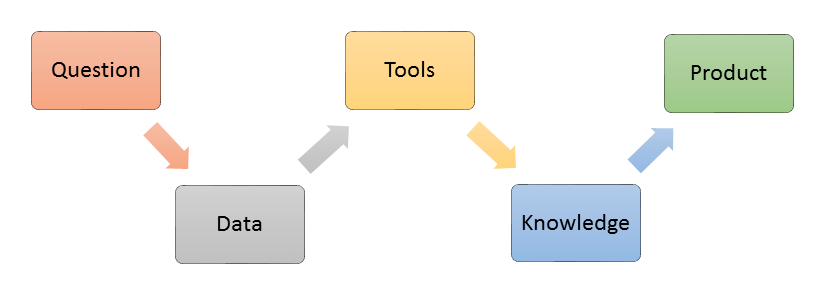
The data analytic process is mainly comprised of the following 5 parts:
- Defining a Data Question
- Collection High Quality Data
- Data Processing with Analytic Toolset
- Applying Algorithm / Knowledge
- Developing a Data Product
Question is the first and most important thing
Assuming you spend 2 weeks collected 1TB of data and ready to perform data analysis, then you randomly do some text processing using the tools you haved learned. You created a word cloud and show your colleague:
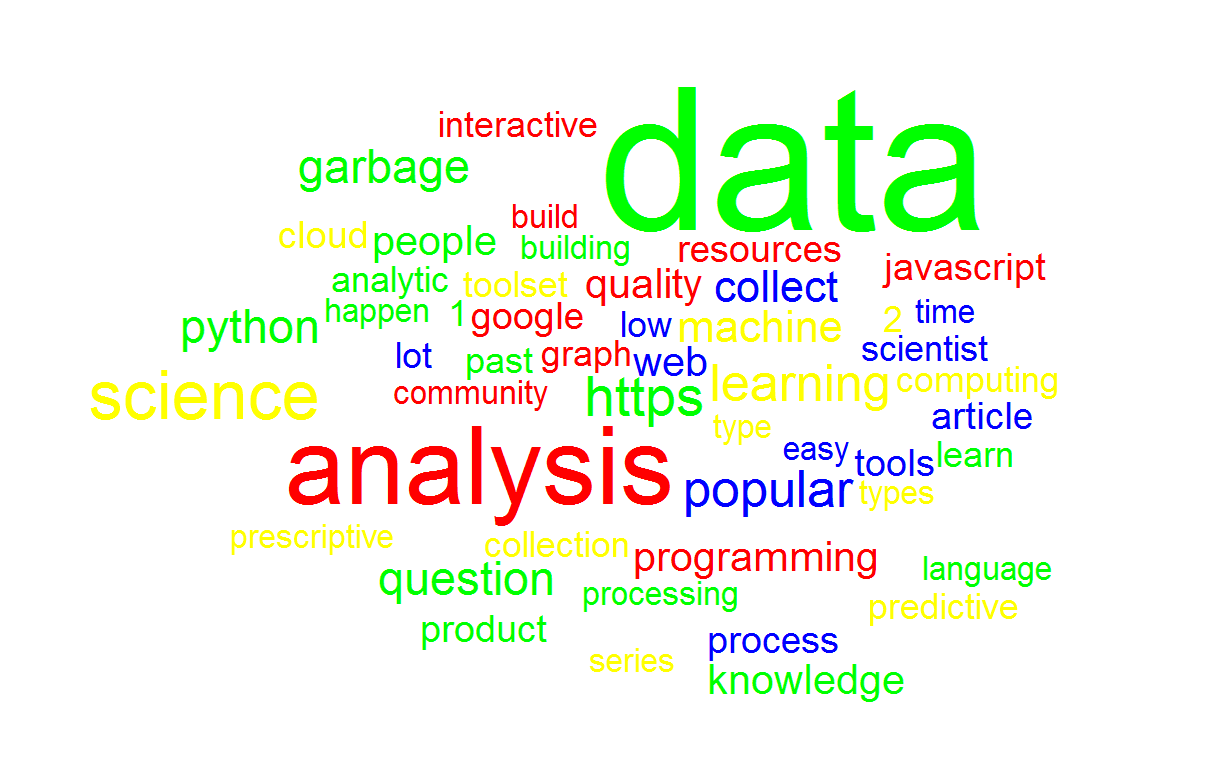
And he/she asks you what does this graphics implied or it is just an artwork? Yes, it is an artwork… But wait! Did you spend 2 weeks of time collecting data to made an artwork? NOPE. Data science is art but it is the art of presenting the insight and answering the questions people are interested in. There is no need to collect the any data to make a word cloud without insight, and we can just use photoshop to accomplish it. Therefore, before spending time to collect data, we should always have some ideas of questions to be solved in our mind.
Generally speaking, there are three types of analysis which serve for different purpose and answer different types of data question:
1. Descriptive Analysis - This is the type of analysis describing or explaining the past. For example, which customer segments engaged most with our products? What is the demographics of the customer who clicked a cretain ads? This type of analysis helps the business to evaluate and review their strategy.
2. Predictive Analysis - If descriptive analysis is about the past, predictive analysis is predict what will happen in the future. For example, what will be the expected marketing cost this year? Which product will be more popular among a group of people? This type of analysis help the business to do budget allocation and strategy planning.
3. Prescriptive Analysis - Predictive analysis focus on what will happen, and prescriptive focus on why it will happen. By doing so, we can recommend possible choices of action and their outcome. One example question would be should we do A, B or C and why?
Data Collection is crucial - Garbage In Garbage Out
After we defined our data question, we collect relevant data. Having high quality data is the second most important thing in data analysis. (I will explain it in more detail in the article “Why data collection is important for data analyst”).
Garbage In Garbage Out – meaning that if the data is in low quality, the analysis will be in low quality as well. A simple scenario would be in Supervised Machine Learning. If the training data set are all wrongly labelled, then there is low chance that the model can predict well. Having low quality data is even worse than having no data because the result could mislead people to make a wrong decision or trust a wrong belief.
Whether we should collect data before or after defining our question, there are drawbacks for each approach. If we collect data first, we may at risk of spending extra effort collecting data which is not useful for the analysis. If we collect afterward, there is chance that we can not backfill the data for previous month/year and missed some important data.
Working efficiently with the analytics toolset
Question & data determined the possibility of an analysis. Analytic tools determines the efficiency of the analysis. Having a sophisticated toolset can potentially speed up your analysis by 10x or more. The word ‘toolset’ doesn’t only mean the software you use but also the hardware / architecture.
In the era of big data analysis, hardware becomes very important. Sometimes your program require a lot of computing power then you may need many CPU cores to speed up your analysis. Besides CPU, recently GPU computing becomes more and more popular. For example, a CUDA-enabled graphic cards could potentially speed up your deep learning training process by 32x with a GPU-enabled framework such as Tensorflow. If you don’t want to manage your own hardware, you can also rent cloud computing resources in AWS, Google, etc. I found this video useful when you decide which cloud service suits your needs.
For the software part, there are four favourite tools or programming languages among data scientist: Spreadsheet, R, Python, Javascript
1. Excel / Google Sheets - Perhaps this is the most controversial one. Some people (like me) don’t like Spreadsheets because of its limited flexiblility and lack of data analysis reproducibility. However, having a excellent skill in spreadsheet is still essential in our work because the duty of data scientist includes communicating with other stakeholders including those non-technical people who are more familar with working on spreadsheet. Moreover, Google Sheet enabled easy collaboration between users which is also important.
2. R / R Studio - R is popular among statistician. It is a flexible programming language which makes it easy to act as a platform between other tools, from connecting to database to generating interactive graph. RStudio is a nice IDE which allow you to work with the programming environment without pain. Tidyverse packages provides easy-to-use programming function for daily data analysis purpose.
3. Python / Jupyter Notebook - Python is the most popular language for building machine learning model. Numpy + Pandas + Matplotlib are the standard set of python library doing data analysis. Besides, there are a lot of neural network framework which has its python interface, such as Google’s Tensorflow. Jupyter notebook provides a good UI to do interactive python programming and to store the output.
4. Javascript / D3js - Javascript has been popular in web development in recent year. On the other hand, data scientists use Javascript to create interactive chart. D3JS is the most popular visualization javascript library. There are lots of example of the snipplet here which worth checking.
Aprt from those mentioned above, there are many other tools or programming languages used by data scientist. Java is popular for building big data architecture, Julia is a newly developing language which claimed to have a high performance for numerical and scientific computing. Torch / Lua are used to building machine learning models.
Learn and Share your knowledge with the community
No data scientist is a unicorn who knows everything. In this technology world new things come everyday and we have to keep learning ourselves and with peers to acquire knowledge and specialize in topics you are interested in. There are many resources in the web which helps you to learn:
The first you could do is reading blogs to get an overview of some data science concept. There are many high quality resources on the web but finding an intuitive article is very important as they can help you to absorb the knowledge easily. Here is an article which lists out some of the resources you would find them interesting.
If you want to go into details of certain subject, there are many free online course available. The most popular are Coursera and Udacity. They provide a large range of courses from Life Science to History (don’t worry, data science is in between) and there is also options to paid for certificate of completion (Of course only if you passed the course!).
When you encounter problems which no one can solve, perhaps Google or Stack Overflow can save you. But you have to make sure you use the correct keyword in your search query, that’s why reading blogs is important.
Kaggle is the most popular data science community. There are machine learning competitions being held frequently. They also provided a platform for the public to share open data, and analysis writeup. You will learn a lot from the community by looking at the examples and raise question in the forum.
Im my opinion, it is useful to join some coding competition, which will help you to build up a data processing mindset and algorithm more than programming skill as you don’t need to do advanced programming in the competition. Codeforces holds coding competition (prize is the experience) regularly and Google held its Code Jam (prize is real money and a T-shirt!) every year.
Build your Data Product
After you have all the data and analysis, the last thing to do is to build a product and present your findings to others in many forms. A data product can be vary in complexity. It can be simple as just an annotated graph or articles, or powerful as a web application.
In R you can simply use Shiny to create your web app to demonstrate interactive plots. In Python you can write a Flask web app. You can also write a markdown file to store your analysis writeup and convert them to a html document. However, these parts may require a lot more technical knowledge and we will talk about it later.
In the next article of this series, we will go into the details of the toolbox we frequently used. Stay tuned!