Introductory Data Science Part 2: The Toolbox
This is part 2 of the series which introduce the basic elements in Data Science.
Last Time, we discussed the process in a Data Science project. Today, we will discuss one of the components - toolset. While it is not possible to cover all the tools in this article, we will focus on the two major toolsets in Data Science: Python and R. For those who have little programming experience, you may encounter a lot of new terms in this article and I will try to give more explanation on those terminology.
Why Open Source Programming Tool?
Many analyst uses analytic software such as Excel, SAS or BI tools such as Tableau. Those software are good in the way that they provide a nice GUI and user-friendly interface. The learning curve for those software is relatively gentle and we could accomplish many essential tasks with just a few scripts of program or formula. However, as a data scientist, these are not sufficient. Programming Tools such as Python and R could give you the following benefit:
-
It is FREE - Free of charge and available for all platform / OS
-
There are lots of learning resources available in the web - Just ask Google
-
We can make use of open source library made by others to simplify our tasks - Usually the task you solved is common for others and programmers are very kind to share their works (Thanks!) :)
-
We can connect to other software using programming language - Imagine if you want to download lots of file from a website automatically, which is impossible with Excel but you can use programming to communicate with Selenium to control your browser programmatically
-
We are able share our works to the community which everyone should be accessible - people don’t have Excel cannot open the Excel file you created
-
Reproducibility is a key element in data analysis - Everyone (including yourself) should be able to reproduce your analysis and review it
Python vs R
Python and R are both popular programming language for data scientist, while python are more favourite for Computer Scientist and R are more favourite for Statistician. I will not try to compare their difference because reader with little/no programming background may not able to get the details. Instead, I will talk about two major situation to decide which one to use.
-
Depends on file format - CSV and JSON are most commonly used file format to store data. CSV (Checkout the dataset I published) is a tabular formatted file while JSON (example) is in key-value pair format. For JSON file, I will difinitely use Python because Python provides a data type called “Dictionary” which works in similarly way to JSON format. Both Python and R is fine for CSV data as they can work with tabular data very well but I would prefer R.
-
Depends on the task - For quick exploratory analysis and plotting, I prefer R. For building machine learning model, I prefer Python. I found that the development time is much faster using R for me but the computation performance is better in python.
So, let’s try installing Python and R in the machine and play with the basic. There are many tutorial in the web teaching Python and R but what I want to focus more is the terminology so that you will be able to get the keywords to search on Google.
R
There are two main components when you start R and it is often confusing to people who don’t have experience in programming. The first one is R which is the program to run R script. It is a command line only program just like python. You don’t interact with it directly but you are actually using it when you run any R program. Another component is called RStudio, which is a IDE for R. It provides a nice UI for you to develop R program.
Installation
Let’s get started:
-
Download and install R
-
Download and install RStudio. There are also paid version and server version for commercial use but you can just use the free desktop version.
-
Run RStudio and you will see the following screen.
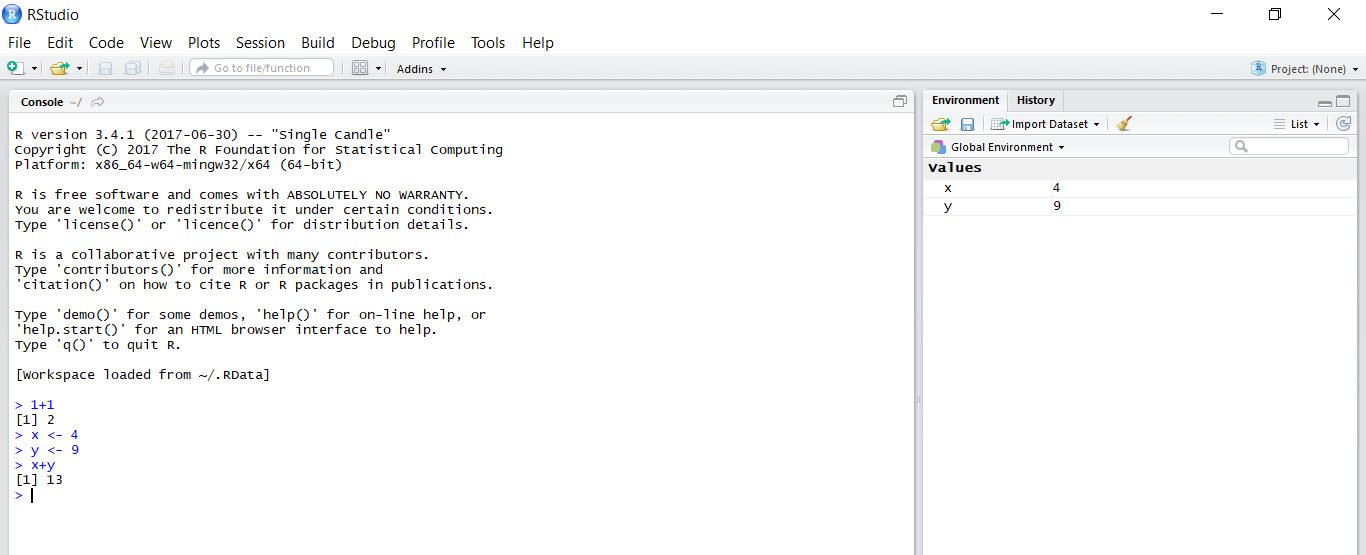
The left panel is the interactive console. You can enter a formula and assign variables as shown.
For more information about R and RStudio, I would strongly recommend you to watch the webinar videos by RStudio. I always believe videos are better learning tools than text for beginners and those videos is sufficient to make you more familiar with the power of R.
But here are some important points I would like to mention:
Dataset
R itself included some datasets for you to play with. The popular one are iris and mtcars. You can load the internal dataset into the environment by data("iris") and data("mtcars"), then display it usng iris and mtcars.
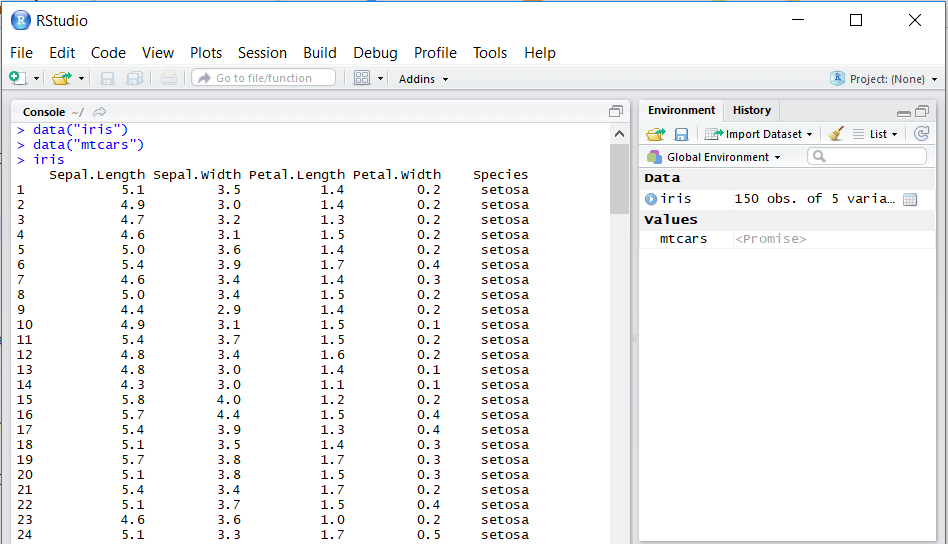
The data are stored in a format called data frame, which is a tabular format consisting of column names and the values like what you usually have in Excel.
Package
Same as other programming languages, one of the most important skill is to make use of packages (or sometimes called library) written by others.
R installation natively come with something what we called base R packages. It provides functions such as computing statistics and doing file I/O. You don’t need to load the base packages explicitly as they are loaded by default in every new session.
You can check the usage of function by typing a ? before the function name.
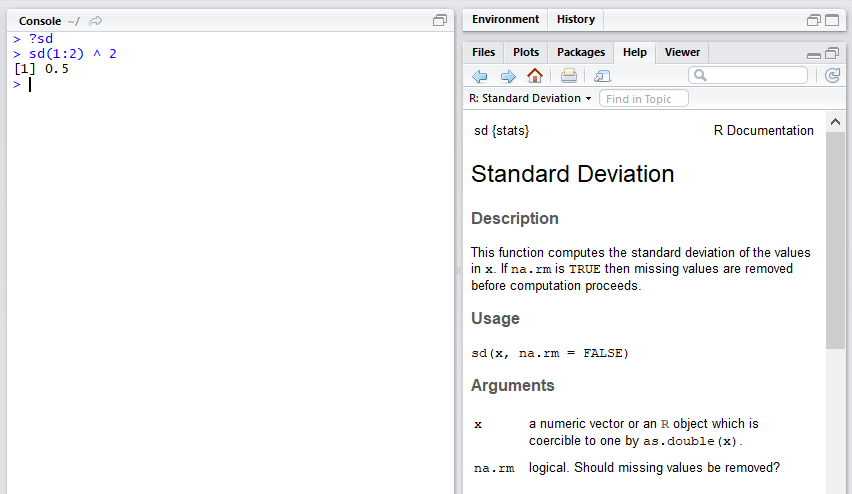
On the top, sd {stat} means the sd function is from the stat package. The help file contains instructions on how to use the function, and if you scroll to the bottom there will be example which you can follow.
As a beginners to learn data science, I would suggest you play with the tidyverse package. It is actually a bundle of packages which help you to do data manipulation, exploratory analysis and data visualization easily. The good point of tidyverse is that the functions are designed to be close to human grammar, which means it is very human-readable and user-friendly. This is extremely important for beginners because it can dramatically reduce your development time.
For further computation performance enhancement, you may consider using data.table package.
After you get the basic by watching RStudio webinar video, I would suggest you to read Advanced R and R packages by Hadley Wickham (who is the author of tidyverse) to get a deeper understanding of the beauty of R language.
Production
After you have a prototype or draft, the next step would be to build a data product. I will go into the detail in later article, but just to give you some ideas, you can take a look at Shiny and Rmarkdown.
Python
Python is one of the most popular languages for building data pipeline and machine learning models as many applications provides their python interface. For data scientist, we usually develop python program with Jupyter Notebook. As suggested by its name, it is like a notebook which enhance reproducibility.
Installation
Unlike R, there are many ways to install python and some OS have python natively. However, for data science, I would recommend installing python with Anaconda. Anaconda is a powerful package manager for python, which help you to solve issuess related to mismatched package versions.
-
Download and install Anaconda
-
Open the command line tools and type
python, you should see it is the anaconda version of python. We are not going to use python directly in console, so you can press Ctrl-D to exit. -
Then typing
conda listwill show a list of python packages you have (Windows will be a bit slow for this command). -
We will have to install the notebook which is in jupyter package. There are many ways to install python packages and the most common is using pip. However, to avoid multiple packages being install, I would suggest always install packages using conda. Only if conda don’t have the packages then you could use pip. Type
conda install jupyterto install jupyter. -
Jupyter notebook, unlike RStudio Desktop, is not a standalone software. However, you can easily set up your own server to use it locally. Type
jupyter notebookin your console and it will say that the Jupyter Notebook is running at http://localhost:888/. -
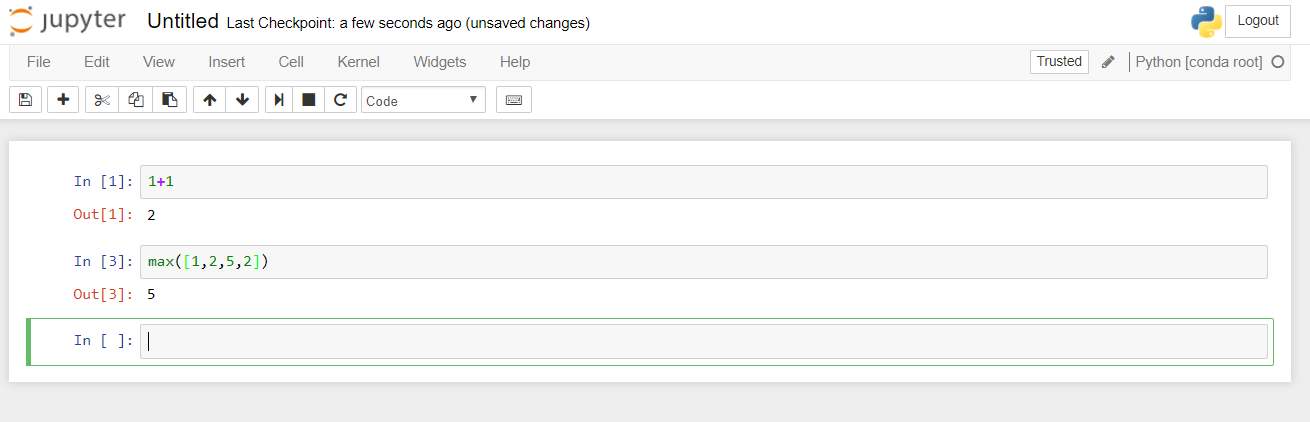
You can create a python script with the notebook and play with it by typing some formula. I think it is easy to use and you could find a bunch of Python resources online.
Package
Here is some commonly used packages by Data Scientist:
- Numpy - For fast vector and matrix operation
- Pandas - For storing and processing data frame
- Scikit-learn - Contains Machine Learning Algorithm
- Matplotlib - For data visualization
- Tensorflow & Keras - For deep learning
Production
For Python, the production process is flexible. Jupyter Notebook itself is already a good presentation tools. However, there are much more than that as python is a general purpose language, for example, you can write a web app with flask.
Summary
Now, I hope that all of you would have a better understanding on how you can get started with data science although there are much more things not covered in this article. In the next article of this series, we will talk about some common basic algorithm for data proccessing we frequently used. Stay tuned!
Please feel free to leave any comment!